TiVo Segmentation Case Study
This paper presents a market analytics–driven case analysis of TiVo, examining the full market research process outlined in the case and evaluating the effectiveness of its segmentation schemes. Using the quantitative exercises from the case as a foundation, the analysis develops a clear hypothesis about how TiVo creates value for different customer segments and how that value can be measured.
The paper critically assesses the strengths and limitations of TiVo’s research design, consumer attitude measurement, and use of correlation, while proposing alternative research and segmentation strategies that could better support customer-centric decision-making. Throughout, the analysis integrates market analytics, customer centricity, and research strategy frameworks to demonstrate how rigorous, data-informed research can guide more effective targeting and long-term strategic positioning.
Part 1 - Segmentation Exercises
Part 2 - Analysis
This case explores TiVo’s entry into the American television market in the 1990s, during which the company ambitiously attempted to redefine consumers’ TV experience. This product was based on the premise that consumers generally wanted more control over what and when they watched, frequently commenting that they sometimes cannot align their personal schedules with the shows they wanted to watch. However, a significant challenge that TiVo faced was in market segmentation: understanding not only who their customers were, but more specifically, what motivates TiVo’s perceived value from the consumers' perspective. Segmentation is not only about dividing the market; it is about identifying the audience that derives the most value from a product or business, and understanding that specific target audience. If done well, segmentation provides businesses with marketing leverage, as the product aligns with the audience’s value perceptions and needs. This crucial understanding of the distinct characteristics and ‘persona’ of the audience informs strategy around who to target, how to communicate, and through what channels.
The market research process in this case focused on transitioning from broad data collection to identifying relevant variables through regression analysis, and then using them to develop appropriate and relevant segmentation schemes for TiVo. Generally, this process is quantitative and structured, a strength when seeking a more systematic and reliable approach that is straightforward.
In the segmentation exercise, I focused on developing two schemes: one based on demographic logic and another based on consumer behaviour. The rationale behind this approach lies in the fact that these two methods are almost inverse of each other; the demographical approach to segmentation brings us insight to how the context of age or stage of life may produce certain apparent behaviours, while the behavioural approach provides insight into how certain behaviours may align with certain aspects of consumers—who the consumers are and what their contexts are. While demographics may sometimes be overlooked as too generic and unrepresentative of actual consumer behavior, they are easier to measure and, especially, remain stable over time, allowing market researchers to have a more grounded basis for their work. Still, demographic segmentation is just a good starting point for approaching segmentation. By employing both of these segmentation approaches, we can gain a richer understanding of TiVo’s market landscape.
The 7-segment scheme is based on the age demographic variable, hypothesizing the existence of discrepancies across ‘annual income’ and ‘most appealing feature/benefit’ between generations. The results of this scheme support these findings; however, a more insightful observation is a general pattern where the younger generation is more willing to spend monthly on electronics, despite having a lower average annual income. They are also more inclined towards interactive, tech-driven features, while older groups prefer convenience and family-oriented functions. This contrasts with the older generation, who generally emphasize family-oriented functions and convenience, while also having a less frequent tendency to buy technology, despite having higher annual incomes.
From this segmentation, we come to an interesting dilemma: should TiVo focus on the younger generation, who demonstrate purchasing intent and enthusiasm for innovative tech, but represent a smaller and less affluent portion of the market, or the older generations, who possess more financial stability and form the majority of the market, but relatively spend less on technology? This may require further research into inter-segmentation within the younger and older generations based on attitude-related variables.
The second segmentation scheme examines consumer behavior in terms of perceived adoption of new technology and purchasing frequency. To check for potential correlative redundancy, correlation analysis was performed, revealing a weak positive correlation (R² = 0.063, Figure 1).This means that both variables would provide distinct explanatory power in distinguishing between segments, ensuring that the segmentation provides meaningful results rather than statistical overlap or predictable conclusions. This segmentation distinguishes between early adopters who frequently purchase new technology, early adopters who do not, late adopters who purchase new technology less frequently, and those who do. Interestingly, the results revealed that late tech adopters primarily shop at mass consumer electronics stores, whereas high-frequency early adopters tend to shop in specialty electronics stores. This implies that shopping channels themselves may reflect and align with values across different consumers— exclusivity for early adopters who frequently buy (tech enthusiasts) versus accessibility and trust for late adopters. This is a crucial insight, as TiVo may now consider how to optimize various sales channels to better cater to specific audiences. Another point of interest is around the early adopters who buy less frequently. This group implies a contradiction between willingness versus ability to buy, which could be explained by the relatively low average annual income and this group’s tendency to shop at retail and discount stores.Even more interestingly, this group represents the greater half of the consumer market (50.5%, as seen in Figure 1). This raises more questions for TiVo’s strategic team—which segment would be the best fit and most compatible with the product and brand image that TiVo wants to convey?
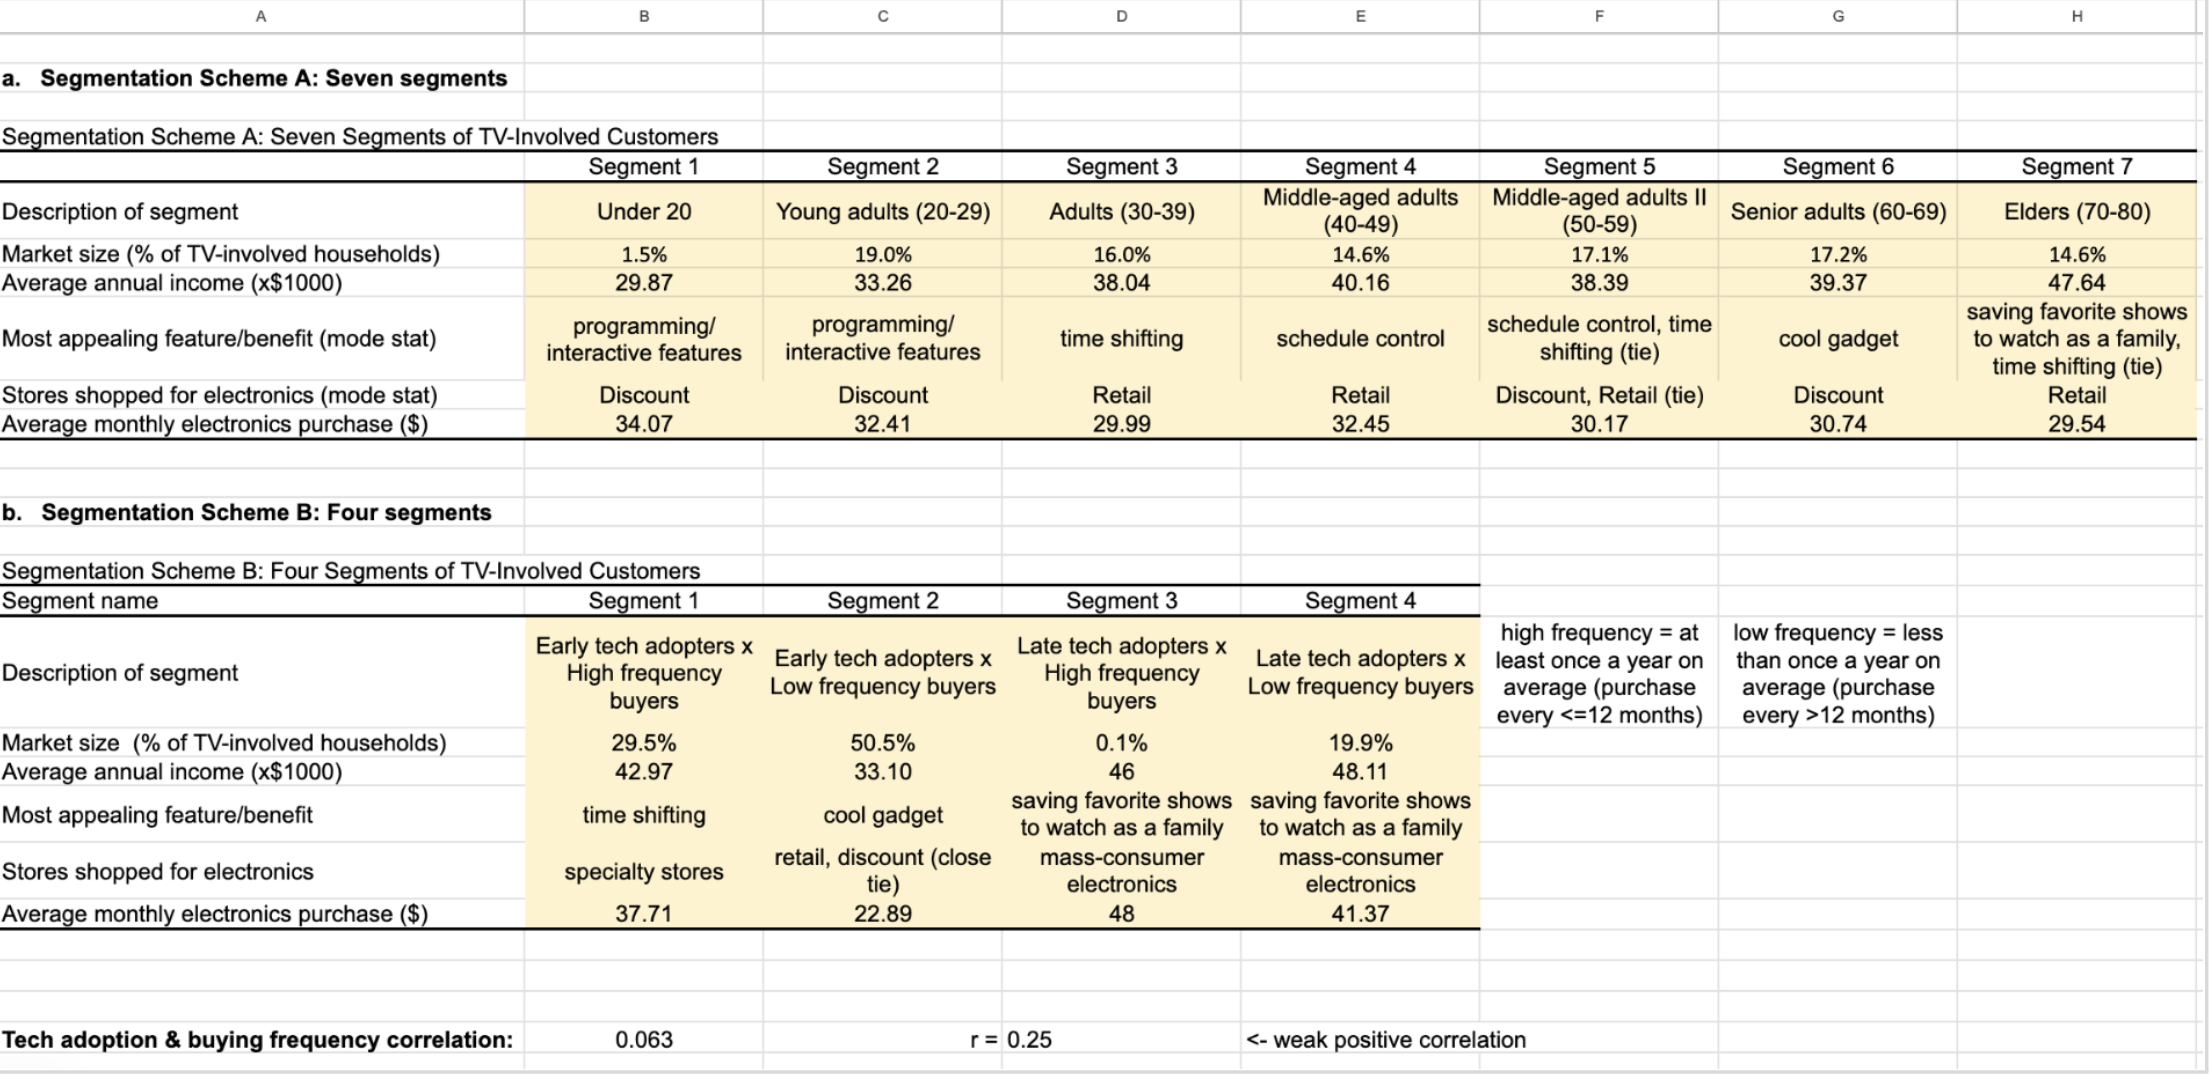
Figure 1. Segmentation schemes.
What is perhaps missing from this research method is a more qualitative approach, not just basing it on behavior and observed choices—the ‘what’—, but also reaffirming the motivation behind those choices—the ‘why’—, which can add significant depth to understanding and, especially, empathizing with consumers’ perceived value regarding TiVo and the general TV experience.
In the initial survey, only two questions could be categorized as attitudinal, reflecting consumers' perceptions of their beliefs and themselves, namely, ‘technology adoption’ and ‘favourite feature’. These variables serve as a starting point in understanding how consumers may relate to technology and TiVo’s product, but are far from fully representative of the complex attitudes that shape purchasing behavior. Both questions are restrictive of scope and depth; we could criticize the limited options each question provides and the exact meaning of these options from the consumer's perspective, which do not exhaust all possible options and force the consumer to align with the given options. ‘Technology adoption’, with options of ‘early’ or ‘late’ captures a static snapshot of consumers’ self-categorization without accounting for any further motivational or emotional factors driving that answer. ‘Favorite feature’ can also be misleading to analysts, as it only provides a narrow view of product appreciation in the specific context of TiVo, without asking what consumers actually value or wish to improve in their current context. These fixed responses restrict survey participants to predefined options that may not accurately align with their actual experiences, oversimplifying complex attitudes. Identifying a respondent’s favorite TiVo feature does not necessarily reveal their challenges with television viewing or their readiness to switch to new technology. Perhaps conjoint analysis could address these limitations, as it relies more on consumers’ self-reported preferences through making trade-offs between product attributes. This is incredibly important when considering how to infer relative preferences and also evaluating their product's performance in the actual market scenario and context. This method also captures the nuances behind preferences; it not only reveals what feature customers may claim to value the most, but also the relative importance of those features when composed differently. Conjoint analysis would create a better foundation for understanding what customers perceive as valuable—in other words, what they are truly willing to pay for.
A technical shortcoming of the segmentation method is the risk of over-generalization within segments; realistically, segments are not absolutely homogeneous, and often, there exist conclusive results that have the highest frequency but do not reflect the majority. Since the mode alone establishes the defining behavior of a given segment, small differences in frequencies can disproportionately skew the interpretation and invoke over-reliance on the results. For example (as seen in Figure 1 above), in segment of the four segment scheme, there is a close tie between retail and discount stores for early tech adopters-low frequency buyers, in terms of electronic shopping locations; in Figure 2, we can see that the frequency of retail overtakes by just 2 points (retail - 218, discount - 216). This is not the only segment or variable that exhibits this behavior, and in some cases, segments have perfect ties between the modes of qualitative values. This highlights the need for a more nuanced segmentation approach that goes beyond simple mode-based summaries. This could involve incorporating measures of distribution and standard deviation, or applying percentage weighting on top of the mode, to provide a more comprehensive picture of what the data truly represents—especially in terms of its extent in representing the segment. This would enable analysts to make more informed decisions regarding marketing strategies and identify qualitative aspects that could be generalized to a wider segment.
Revisiting the conjoint analysis approach, this issue could also be eliminated—or at least greatly minimized—since conjoint analysis captures the relative weight of each attribute level rather than simply reporting the most frequently reported response. In contrast to a mode-based segmentation that compresses consumer diversity into categorical generalizations, conjoint analysis treats consumer preferences as multidimensional trade-offs, detecting subtle variations within segments and quantifying marginal differences in preference strength, rather than reducing them to binary or mode-based outcomes.
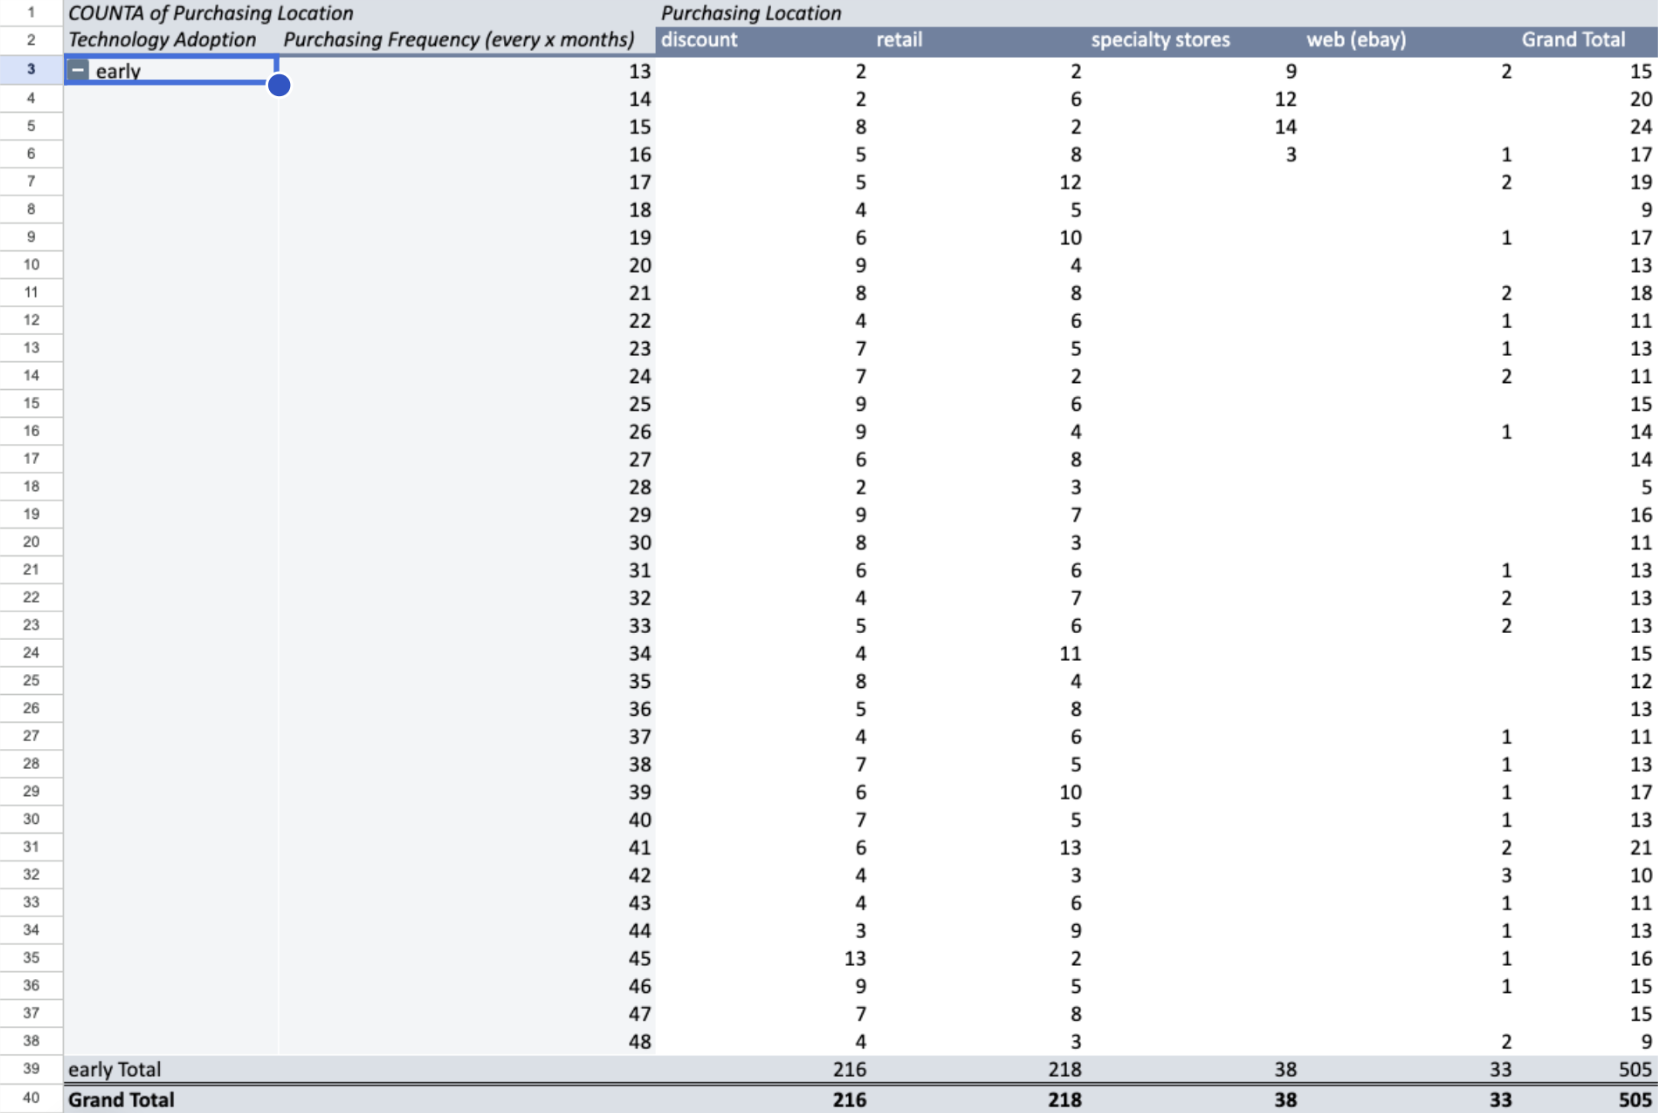
Figure 2. Pivot table displaying the distribution of choices around ‘purchasing location’.
